


插件描述:基于AmCharts 4实现的蛇形时间线
更新时间:2020-03-09 11:05:11
修改数据请编辑script.js中
chart.data = [{
    "category": "Module #1",
    "start": "2019-01-10",
    "end": "2019-01-13",
    "color": colorSet.getIndex(0),
    "task": "Gathering requirements"
}, {
    "category": "Module #1",
    "start": "2019-02-05",
    "end": "2019-04-18",
    "color": colorSet.getIndex(0),
    "task": "Development"
}....];
PREVIOUS:
NEXT:
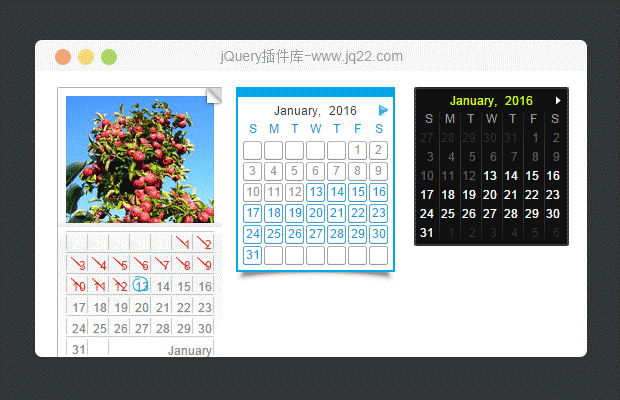
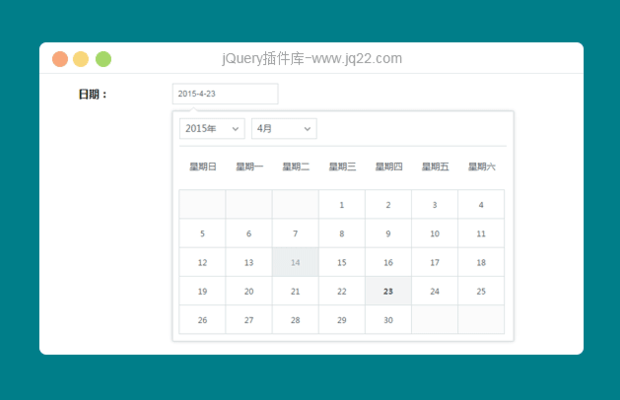
相关插件-日期和时间


讨论这个项目(2)回答他人问题或分享插件使用方法奖励jQ币 评论用户自律公约


😃
- 😀
- 😉
- 😥
- 😵
- 😫
- 😘
- 😡
- 👍
- 🌹
- 👏
- 🍺
- 🍉
- 🌙
- ⭐
- 💖
- 💔
😃
取消回复
- 😀
- 😉
- 😥
- 😵
- 😫
- 😘
- 😡
- 👍
- 🌹
- 👏
- 🍺
- 🍉
- 🌙
- ⭐
- 💖
- 💔
